Industrial production technologies are rapidly advancing, and traditional metrology is increasingly turning to non-contact measurement techniques to keep pace. To maintain the higher throughputs required by product demands, production metrology processes are moving from the lab to the manufacturing line, which is driving the emerging trend towards inline metrology and integrated end-to-end production enabling the rapid march towards Industry 4.0.
Companies that can enable these two key approaches will set the pace. The problem is, how? And, the solution is the Digital Twin. In this post, we will look at data integrity and the use of digital twins in metrology. First, we will define the digital twin and explain how we model one, delve into surface geometry and true value measurements, and finally discuss the difference between data quality and data quantity.
What’s a Digital Twin
A Digital Twin is a set of digital data that represents a part in the real world – basically, an electronic representation of a physical part. Digital Twins can carry a range of information, from intrinsic to comprehensive, that offer significant benefits beyond just a production setting. Benefits include:
- End-to-end part traceability
- Robust qualitative and quantitative feedback to the design and prototyping processes
- Real-time (or near-real-time) feedback to the upstream work center for production adjustments
- Inline comparison of 3D point clouds to 3D design models
- In-process, in-line inspections to identify tool wear in 3D models for preventative maintenance and real-time adjustments to CNC work centers
- Support for Maintenance Repair Operations (MRO) scanning legacy non-CAD model parts and creating 3D models or using point clouds as reference.
Though once used purely in a production setting, the digital twin is increasingly being extended throughout the lifecycle of a part. In the medical implant industry, for example, end-to-end part traceability is extremely valuable, as a Digital Twin can follow the part from production all the way to the patient.
For the Digital Twin to be of any value, though, requires that the digital representation of the part be extremely precise. So how do we model a Digital Twin? Simply put, the Digital Twin is determined by the convention and parameters of the standards and metrology references being used. Our engineers create designs with tools such as SolidWorks, that make perfect parts as a model with perfect surfaces – something that doesn’t exist in production, so we apply tolerances and accept deviations based on the capabilities of our production equipment. The key to a successful digital twin is to agree on the tools and methods, and then apply them consistently.
Surface Geometry and “True Value” Measurements
The plane is a mathematical model of a surface, or an approximation of a surface, defined by three points – two points to make a line and a third point to define the plane. This has long been the accepted method of defining a plane. What happens if we choose four points instead of three? We define three different planes, but which is a true surface? None of them, and all three of them.
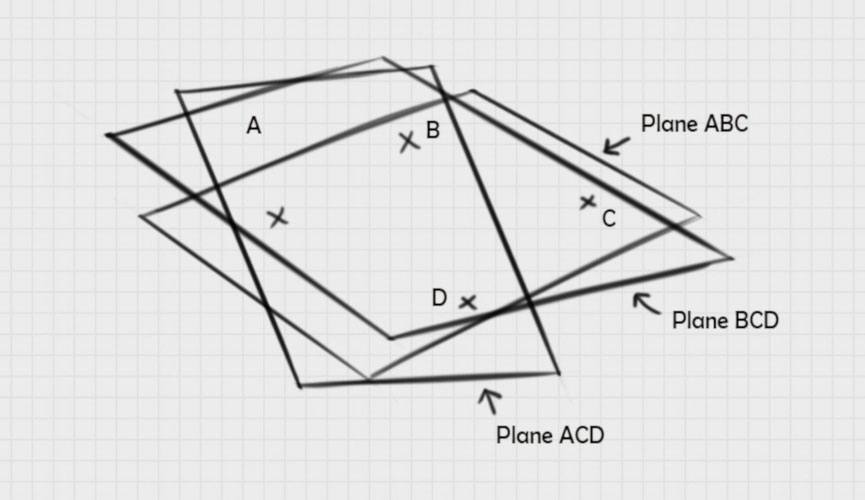
All three mathematically valid planes are models of the same surface; however, any of the three, or all of them together, are insufficient to define the surface. As illustrated in the figure below, a real part features grooves and ridges, so the calculated plane depends entirely on where you contact the surface. When a tactile probe measures the surface, you may get the three valleys – i.e., Plane DEF – while a larger diameter probe would likely hit the tops of the ridges – i.e., Plane ABC. Changing the way we collect data points changes the way we represent the model, which changes the results. Neither is right or wrong, but each is different based on the frame of reference and the data point origins.
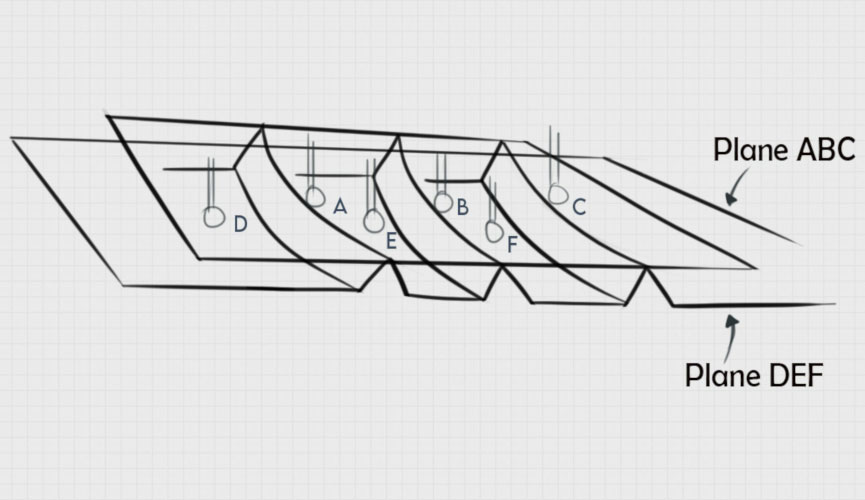
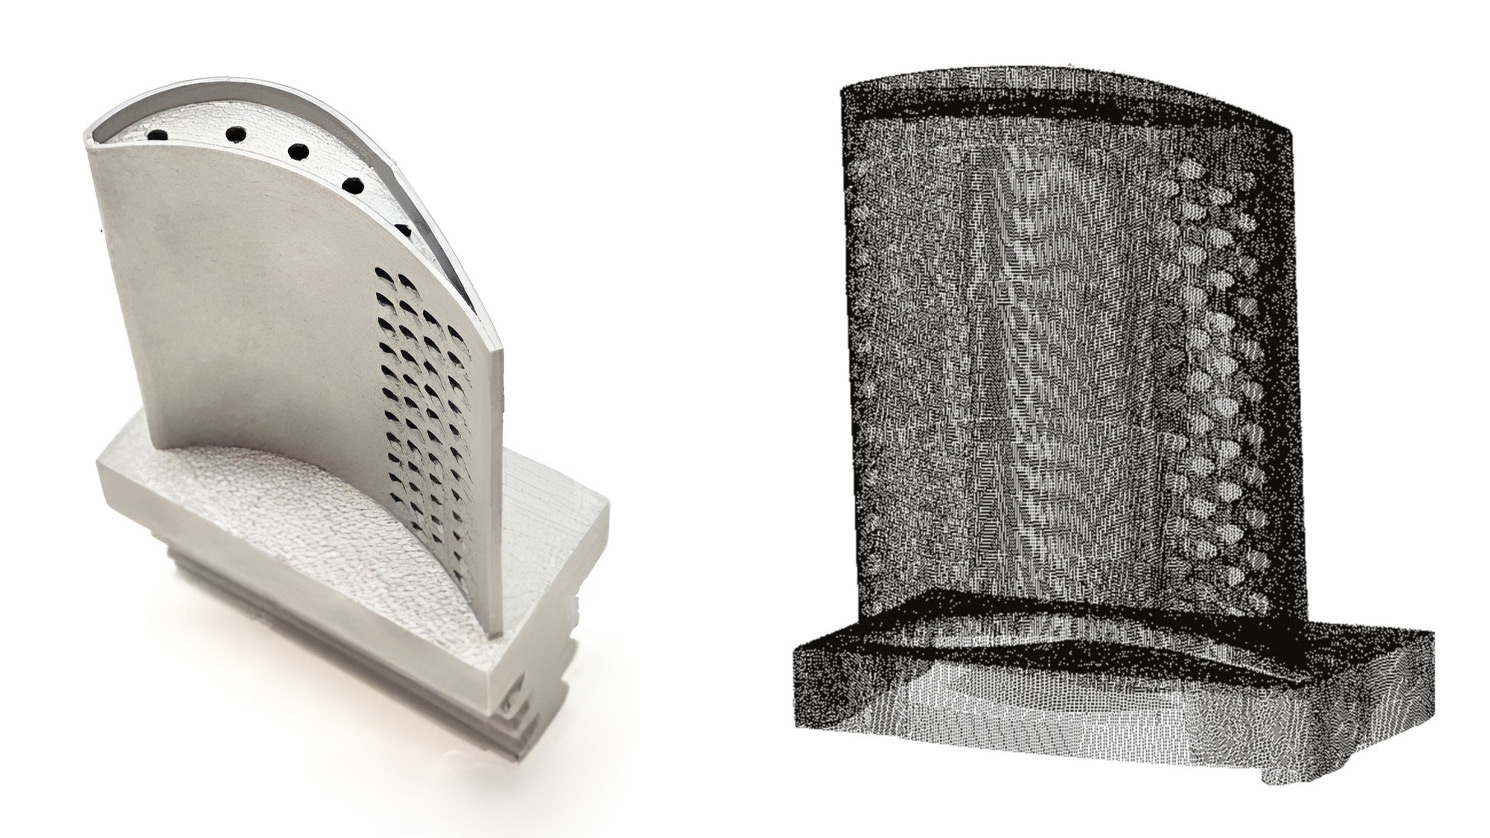
With non-contact technologies, a dense point cloud (aka “The Digital Twin”) alleviates this measurement ambiguity brought forth by various tactile measurement systems.
Ready to begin?
Data “Q” – Quality and Quantity
Data quality is critical for the Digital Twin. When addressing data quality, the first place to start is with our instruments. Standards such as ISO 10360 have been designed to evaluate consistency across different tactile systems. Unfortunately, this standard may not be the best way of comparing tactile and non-contact tools because each system generates different errors. To account for these differences, ISO 10360 tests generate a Maximum Permissible Error (MPE) to compare systems.
Metrology is concerned with measurement error or deviations from a value considered “true”. If we compare two comparable measurement tools, the true measurement value would be accepted from the instrument with the smallest error. Generally, very few non-contact systems go through the entire ISO 10360 standardization process due to these different errors in measurements.
While many will say that tactile measurements are more accurate than non-contact, this is not necessarily true. Each technique generates errors, just different errors. Tactile methods, which capture a small number of discrete measurements, face some common errors, including the Ball Correction Error and Hysteresis Error. Non-contact systems, however, which capture a point cloud consisting of tens of thousands to millions of data points, generate different errors, which we will examine a bit more closely next.
Let’s look at a few examples of some tactile and non-contact errors, and how such errors are overcome with non-contact measurement techniques.
Metrology is moving from the lab to the manufacturing line, which brings non-contact techniques, digital twins, and the integrity of point clouds versus discrete measurement data under increased scrutiny. Earlier, we started discussing the Digital Twin. Specifically, we explained the purpose of the Digital Twin, the contact and non-contact methods used to create them, and the impact of both data quantity and quality on the integrity of the Digital Twin. In this post, we’ll delve deeper into the value of big data, look at some examples of tactile and non-contact measurement errors, and finally explore how non-contact measurement techniques can overcome errors through both mathematics and magic.
Data Quality and Measurement Errors
As we previously noted, the common perception is that tactile measurements are more accurate than non-contact, but this is not necessarily true. Each of the methods generates different errors, but the more critical point is how we overcome these errors.
Tactile methods face some common errors, including the Ball Correction Error (see Figure 1) and Hysteresis Error. With probes tips typically in the 2-8mm diameter range, tactile methods capture a small number of discrete measurements, often missing out on data in deeper valleys by riding over the ridges of a surface.
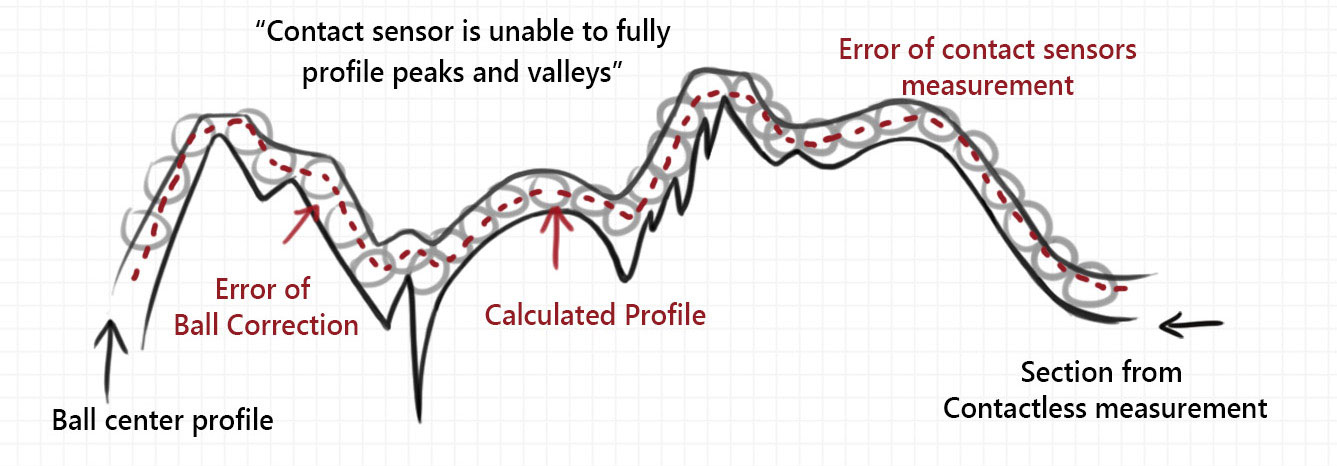
On the other hand, non-contact sensors use lasers or WLI, where there is a spot size when scanning a surface that is akin to the diameter of the probe tip. This spot size is typically in the 3-15µm range, or ~100x smaller than a tactile probe. By way of comparison, think of the diameter of the sun vs the diameter of the earth, where the touch probe is the sun and the non-contact sensor is the earth. As a consequence, non-contact systems overcome issues faced by tactile systems by capturing a point cloud consisting of tens of thousands to millions of data points.
This is not to say that non-contact methods are flawless. These methods also generate errors, just different errors. When gathering all of the data for the point cloud, non-contact sensors have a thickness – commonly referred to as noise. This noise represents the distance of points measured, which is not exactly the same for each data point. Noise can be resolved through two primary methods. One is instrument calibration, which can be quickly performed between scans. The second method is by generating a range of results, rather than a single result, which better offsets the error through data quantity. Non-contact techniques often struggle to measure specular or reflective surfaces. This problem is typically overcome by applying a coating to the surface, reducing reflectivity. By using advanced, high-speed lighting and sensor adjustments, our platform does not require any additional coating to measure specular surfaces.
Simply put, both measurement methods generate errors, but non-contact methods have the distinct advantage to overcome them. Just by way of numbers, by capturing a larger quantity of data points (the point cloud), non-contact methods provide a closer representation of the real surface.
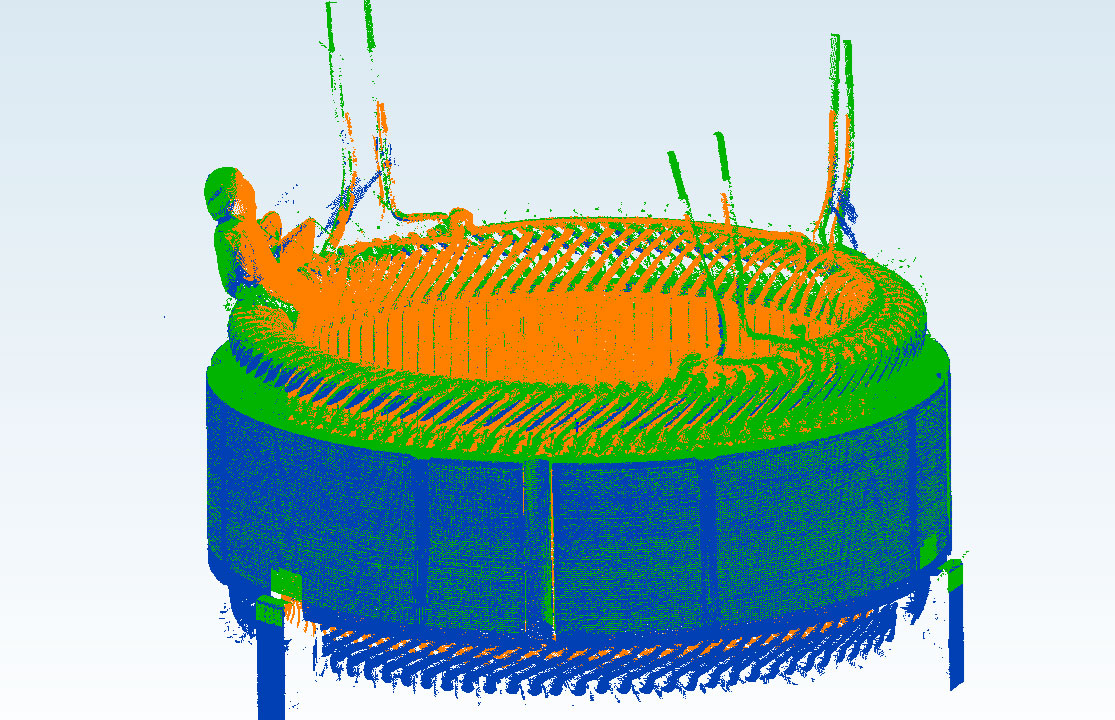
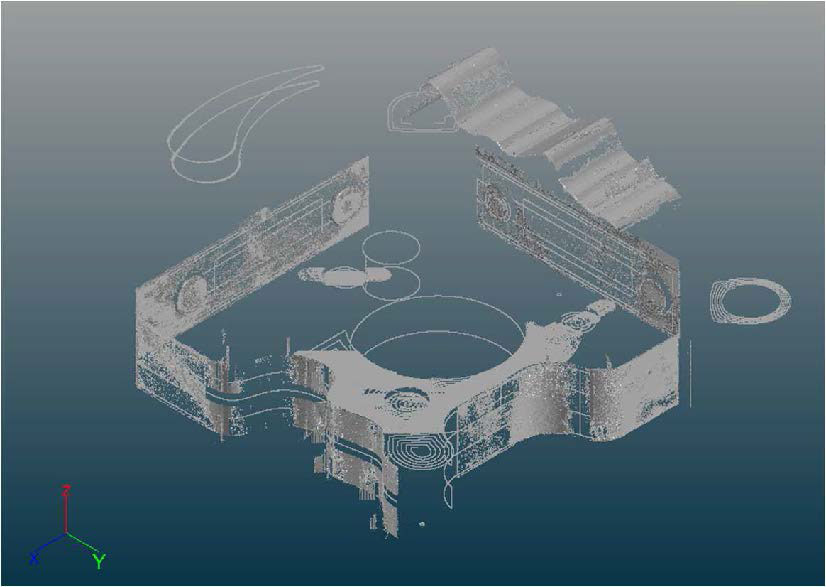
Now let’s look at a real-world example. We analyzed a part with complex features found on parts from several industry verticals. Multiple sensors gathered approximately 4 million data points with all CTQs of interest for the part. Each of the generated point clouds were aggregated into the Digital Twin illustrated in Figure 2.
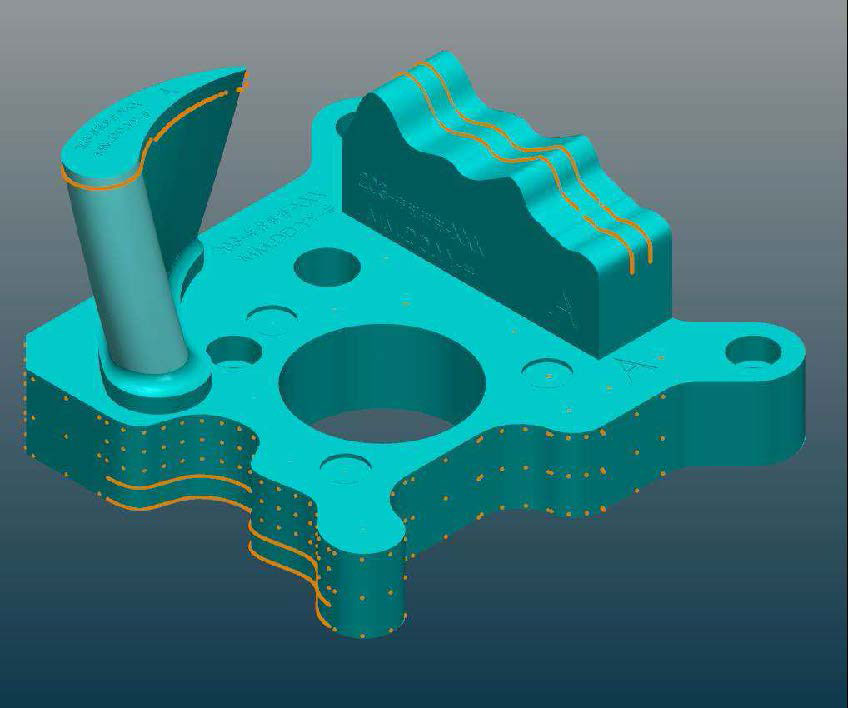
This same part was measured using a tactile method to gather the same CTQs. The tactile method, shown in Figure 3, gathered approximately 1,200 data points and took 14-15 mins to complete the scans. In terms of speed, our platform captured the 4 millions points in ~5mins – nearly 3x faster. This speed and accuracy allows for the integration of metrology and inspection functions directly into the production line, enabling efficiencies in product quality. Products with complex CTQs can be directly inspected inline. And, the digital twin capabilities enables data to be fed back to the MES and various production systems in real time to improve production efficiencies. For example, if it is observed that the part tolerances are worsening, it could indicate that a tool upstream on the production line needs to be fixed. It could be that a drill bit is wearing out and needs to be replaced. Such a robust feedback system will not only ensure product quality, but reduces waste while also ensuring machine or line up time(s).
The Magic of Big Numbers
Non-contact methods clearly generate a large amount of data – and that’s the point. That’s a very critical component at the heart of the Digital Twin. These big numbers – these point clouds made of up millions of data points – build confidence in the Digital Twin, both in tracking and your confidence level that your Digital Twin is an accurate representation of your entire part. If we assume two instruments with comparable levels of precision using ISO10360 as a yardstick, and we look at measuring a section with 100 points, optical sensors offer a single point error impact significantly lower than a tactile single point error. The single point error impact on 100 points (a typical tactile measurement) would have 1/100 the impact of an optical sensor generating 1 million points. The optical sensor single point error impact would be more than 10,000x smaller!
More significantly, the statistical advantage of a point cloud’s big numbers includes the overall measurement error over the entire distribution, which is much smaller than a single point error. The uncertainty decreases as the sample size increases. Simply put, a high-density model is a closer representation of the real surface than a low-density model. More is better.
